
Hello:
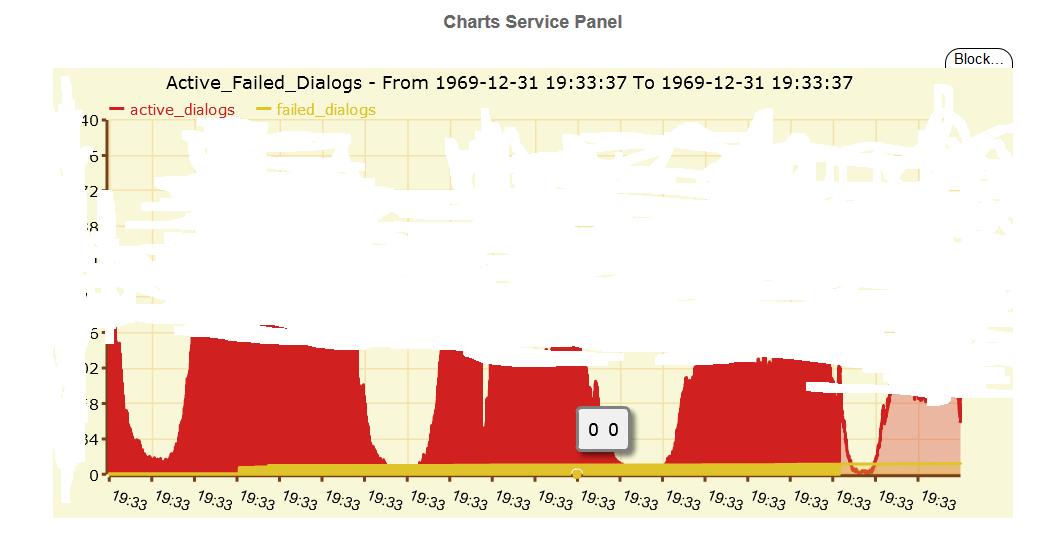
I added a graphic to Siremis of my actives dialogs. But, it only shows unix time (From 1969-12-31 19:33:37 To1969-12-31 19:33:37) as Xaxis (19:33). I had version 4.2 and never saw it correctly, I just updated to version 4.4 and I see the same problem.Please see the attachment file with the graph, and my configuration files and table bellow
Thanks in advance.
My /var/www/siremis-4.4.0/siremis/modules/ser/view/xxxx.xml file
?xml version="1.0" standalone="no"?>
<EasyView Name="ChartsSumdialogsView" Description="Charts" class="EasyView" Tab="" TemplateEngine="Smarty" Access="SERAdmin.Administer_Modules" TemplateFile="view.tpl">
<FormReferences>
<Reference Name="ser.cms.form.ChartsForm"/>
</FormReferences>
</EasyView>
----------------------------------------------------------- My siremisCharts.xml ----------------------------------------------------------
<ChartGroup name="sumdialogs"> <Chart name="sumdialogs" table="active_dialogs" title="Active_Failed_Dialogs" type="area" order="reverse" orderby="ORDER BY id DESC" limit="LIMIT 10080"> <XAxis> <!-- <Item name="date_created" data="hour(date_created)" title="date_created" type="timestamp"/> --> <Item name="date_created" data="date_created" title="date_created" type="timestamp"/> </XAxis> <YAxis> <Item name="active_dialogs" data="active_dialogs" title="active_dialogs" type="dataset" color="#D02020"/> <Item name="failed_dialogs" data="failed_dialogs" title="failed_dialogs" type="dataset" color="#DFC329"/> </YAxis> </Chart> </ChartGroup>
--------------------------------------------------------------------------------------- See bellow, the portion of the table used to build the graphic, the column "date_created" is the problem, and the format is "TIMESTAMP"
# id, date_created, active_dialogs, early_dialogs, expired_dialogs, failed_dialogs, processed_dialogs, '1', '2017-04-11 14:40:40', '220', '0', '1219', '37', '6879491' '2', '2017-04-11 14:42:02', '206', '0', '1219', '37', '6879604' '3', '2017-04-11 14:43:01', '215', '0', '1219', '37', '6879685' '4', '2017-04-11 14:44:01', '191', '0', '1220', '37', '6879744' '5', '2017-04-11 14:45:02', '203', '0', '1220', '37', '6879837' '9', '2017-04-11 14:46:01', '211', '0', '1220', '37', '6879929' '11', '2017-04-11 14:47:01', '234', '0', '1220', '37', '6880019' '12', '2017-04-11 14:48:01', '222', '0', '1220', '37', '6880087'

Hello,
again, try to set the type of the time column to int, so it is retrieved as numeric timestam, not as formated datetime.
Cheers, Daniel
On 13.09.17 06:16, Humberto Rodríguez wrote:
Hello:
I added a graphic to Siremis of my actives dialogs. But, it only shows unix time (From 1969-12-31 19:33:37 To1969-12-31 19:33:37) as Xaxis (19:33). I had version 4.2 and never saw it correctly, I just updated to version 4.4 and I see the same problem.Please see the attachment file with the graph, and my configuration files and table bellow
Thanks in advance.
My /var/www/siremis-4.4.0/siremis/modules/ser/view/xxxx.xml file
?xml version="1.0" standalone="no"?>
<EasyView Name="ChartsSumdialogsView" Description="Charts" class="EasyView" Tab="" TemplateEngine="Smarty" Access="SERAdmin.Administer_Modules" TemplateFile="view.tpl">
<FormReferences>
<Reference Name="ser.cms.form.ChartsForm"/>
</FormReferences>
</EasyView>
My siremisCharts.xml
<ChartGroup name="sumdialogs"> <Chart name="sumdialogs" table="active_dialogs" title="Active_Failed_Dialogs" type="area" order="reverse" orderby="ORDER BY id DESC" limit="LIMIT 10080"> <XAxis> <!-- <Item name="date_created" data="hour(date_created)" title="date_created" type="timestamp"/> --> <Item name="date_created" data="date_created" title="date_created" type="timestamp"/> </XAxis> <YAxis> <Item name="active_dialogs" data="active_dialogs" title="active_dialogs" type="dataset" color="#D02020"/> <Item name="failed_dialogs" data="failed_dialogs" title="failed_dialogs" type="dataset" color="#DFC329"/> </YAxis> </Chart> </ChartGroup>
See bellow, the portion of the table used to build the graphic, the column "date_created" is the problem, and the format is "TIMESTAMP"
# id, date_created, active_dialogs, early_dialogs, expired_dialogs, failed_dialogs, processed_dialogs, '1', '2017-04-11 14:40:40', '220', '0', '1219', '37', '6879491' '2', '2017-04-11 14:42:02', '206', '0', '1219', '37', '6879604' '3', '2017-04-11 14:43:01', '215', '0', '1219', '37', '6879685' '4', '2017-04-11 14:44:01', '191', '0', '1220', '37', '6879744' '5', '2017-04-11 14:45:02', '203', '0', '1220', '37', '6879837' '9', '2017-04-11 14:46:01', '211', '0', '1220', '37', '6879929' '11', '2017-04-11 14:47:01', '234', '0', '1220', '37', '6880019' '12', '2017-04-11 14:48:01', '222', '0', '1220', '37', '6880087'
Kamailio (SER) - Users Mailing List sr-users@lists.kamailio.org https://lists.kamailio.org/cgi-bin/mailman/listinfo/sr-users
-
 Daniel-Constantin Mierla
 -
 Humberto Rodríguez