
I catched issue with In the Kamailio logs i see
ssl bug #1491 workaround: not enough memory for safe operation: shm=10219080 threshold2=11796480
Current stat about shared memory
[root@sbc-a1 ~]# kamctl stats shmem { "jsonrpc": "2.0", "result": [ "shmem:fragments = 528", "shmem:free_size = 11343104", "shmem:max_used_size = 124449952", "shmem:real_used_size = 122874624", "shmem:total_size = 134217728", "shmem:used_size = 58728144" ], "id": 703182 }
But when kamailio started
[root@sbc-a1 ~]# kamctl stats shmem { "jsonrpc": "2.0", "result": [ "shmem:fragments = 122", "shmem:free_size = 112534264", "shmem:max_used_size = 22372528", "shmem:real_used_size = 21683464", "shmem:total_size = 134217728", "shmem:used_size = 12833888" ], "id": 703670 }
What is stange a lot of fragments. How it can be troubleshooted? Can memory manager show info about each fragment like when fragment are created an and which module requested fragment?

Hello Sergey,
your shown number of 500 fragments are not much and should not concern you. I would suggest to just increase the shared memory. About 128MB RAM is probably not enough for your server, configure it to 256MB or more, if you have.
Cheers,
Henning
-- Henning Westerholt – https://skalatan.de/blog/ Kamailio services – https://gilawa.comhttps://gilawa.com/
From: Sergey Safarov s.safarov@gmail.com Sent: Dienstag, 8. August 2023 07:15 To: Kamailio (SER) - Users Mailing List sr-users@lists.kamailio.org Subject: [SR-Users] No
I catched issue with In the Kamailio logs i see
ssl bug #1491 workaround: not enough memory for safe operation: shm=10219080 threshold2=11796480
Current stat about shared memory
[root@sbc-a1 ~]# kamctl stats shmem { "jsonrpc": "2.0", "result": [ "shmem:fragments = 528", "shmem:free_size = 11343104", "shmem:max_used_size = 124449952", "shmem:real_used_size = 122874624", "shmem:total_size = 134217728", "shmem:used_size = 58728144" ], "id": 703182 }
But when kamailio started
[root@sbc-a1 ~]# kamctl stats shmem { "jsonrpc": "2.0", "result": [ "shmem:fragments = 122", "shmem:free_size = 112534264", "shmem:max_used_size = 22372528", "shmem:real_used_size = 21683464", "shmem:total_size = 134217728", "shmem:used_size = 12833888" ], "id": 703670 }
What is stange a lot of fragments. How it can be troubleshooted? Can memory manager show info about each fragment like when fragment are created an and which module requested fragment?
Thanks Henning Sure I will double increase memory used by Kamailio
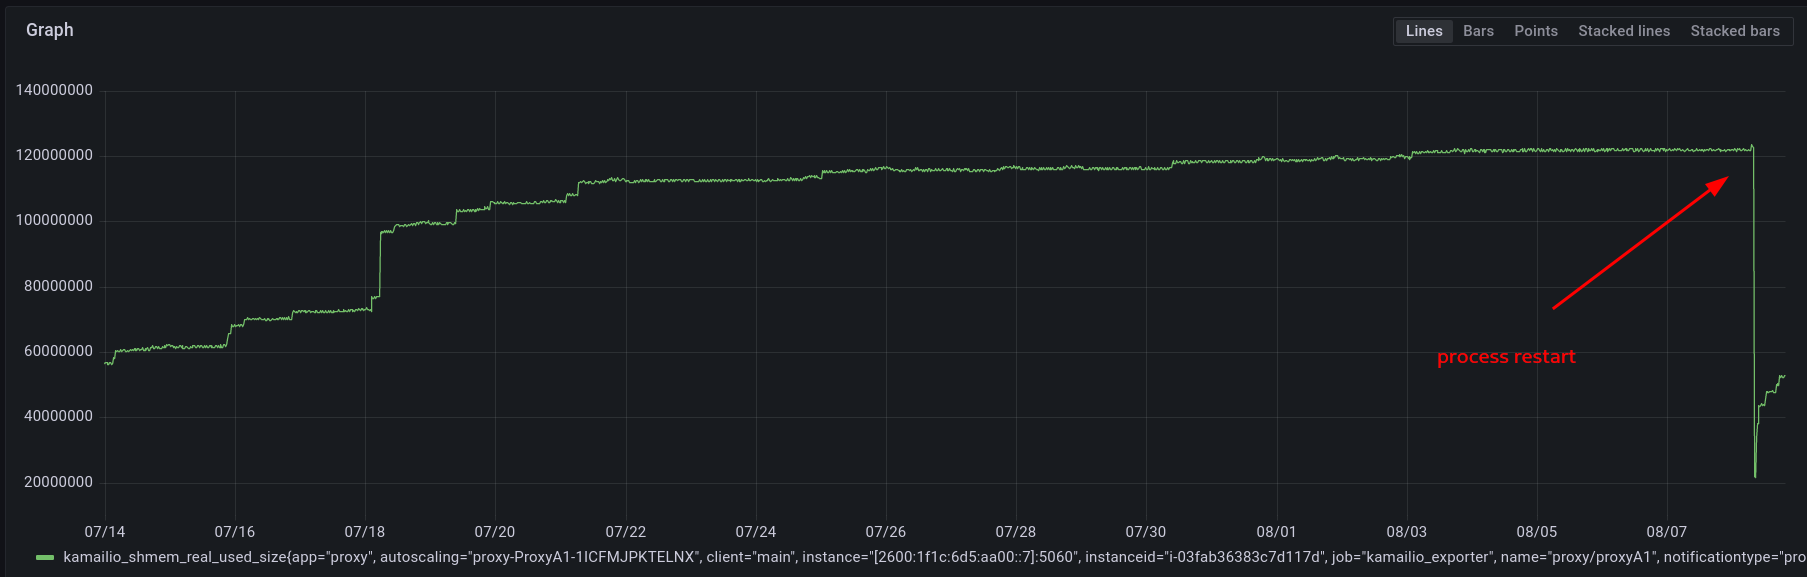
Could you check "shmem_real_used_size" for last 3 weeks [image: image.png]
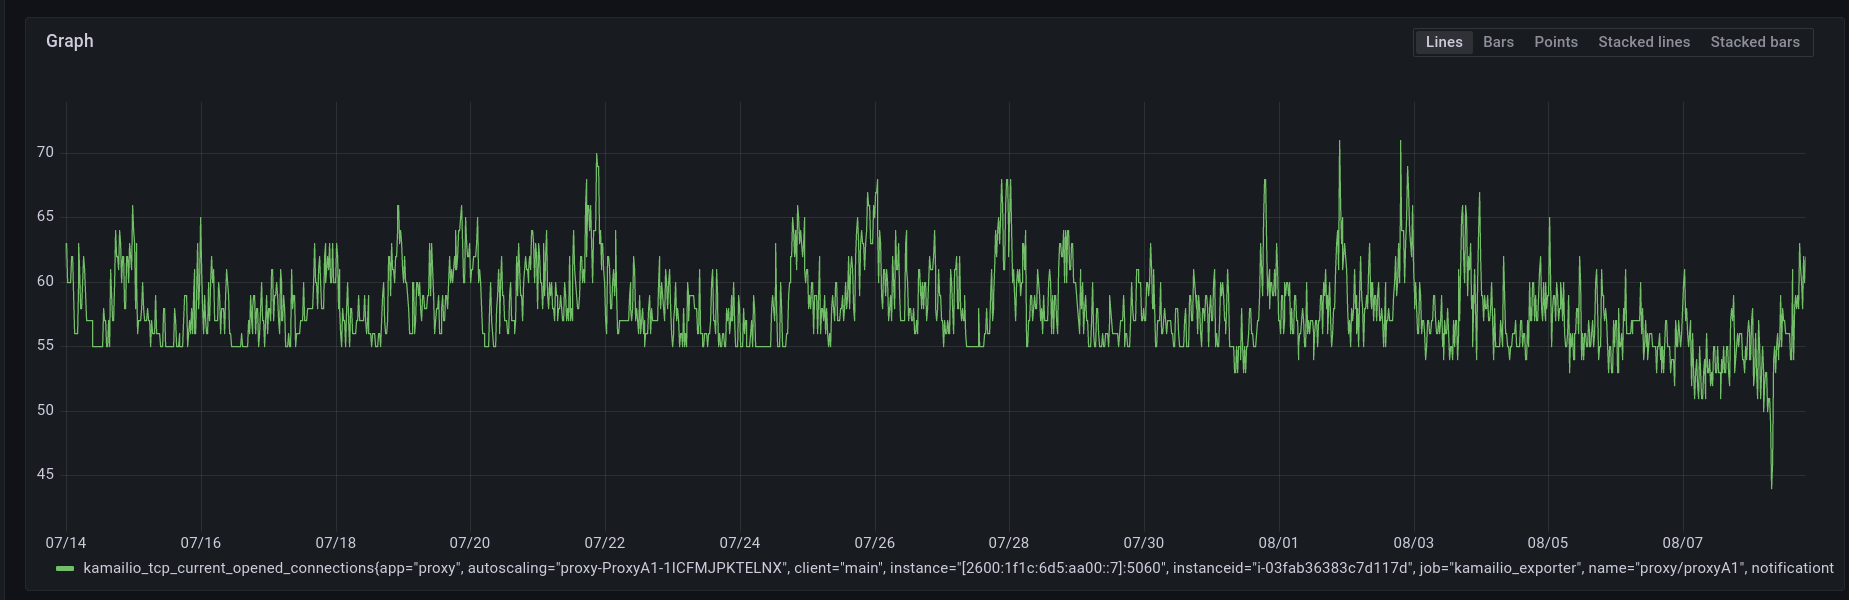
Half of this memory used by TLS module Module: tls { ksr_tls_fix_domain(1057): 2496 tls_new_domain(187): 896 tls_new_cfg(1553): 48 tls_ct_wq_init(49): 8 mod_init(375): 8 mod_init(359): 8 ser_realloc(299): 6434632 ser_malloc(293): 43314912 Total: 49753008 } Here is graph of "tcp_current_opened_connections" metrics
[image: image.png]
Amount of TCP and TLS connections is the same but used memory grows and for one TCP conection used about 49753008 / 70 = 710757 bytes per one connections.
I think 700kb of memory for one TLS connections to much.
What you think?
Hi Sergey,
as you surely know, the shared memory is also used for other purposes, like transactions, routing data from modules and so on. With only 70 connections it’s a bit difficult to judge the memory per connection, as the tls module also has some fixed overhead for management and so on.
What about just increasing the shared memory and then monitoring it for a longer term. If you have a memory leak, it would be still show in the graph over time.
Cheers,
Henning
-- Henning Westerholt – https://skalatan.de/blog/ Kamailio services – https://gilawa.comhttps://gilawa.com/
From: Sergey Safarov s.safarov@gmail.com Sent: Dienstag, 8. August 2023 18:40 To: Henning Westerholt hw@gilawa.com Cc: Kamailio (SER) - Users Mailing List sr-users@lists.kamailio.org Subject: Re: [SR-Users] No
Thanks Henning Sure I will double increase memory used by Kamailio
Could you check "shmem_real_used_size" for last 3 weeks [cid:image001.png@01D9CAA2.9F1AB2A0]
Half of this memory used by TLS module Module: tls { ksr_tls_fix_domain(1057): 2496 tls_new_domain(187): 896 tls_new_cfg(1553): 48 tls_ct_wq_init(49): 8 mod_init(375): 8 mod_init(359): 8 ser_realloc(299): 6434632 ser_malloc(293): 43314912 Total: 49753008 } Here is graph of "tcp_current_opened_connections" metrics
[cid:image002.png@01D9CAA2.9F1AB2A0]
Amount of TCP and TLS connections is the same but used memory grows and for one TCP conection used about 49753008 / 70 = 710757 bytes per one connections.
I think 700kb of memory for one TLS connections to much.
What you think?
-
 Henning Westerholt
 -
 Sergey Safarov